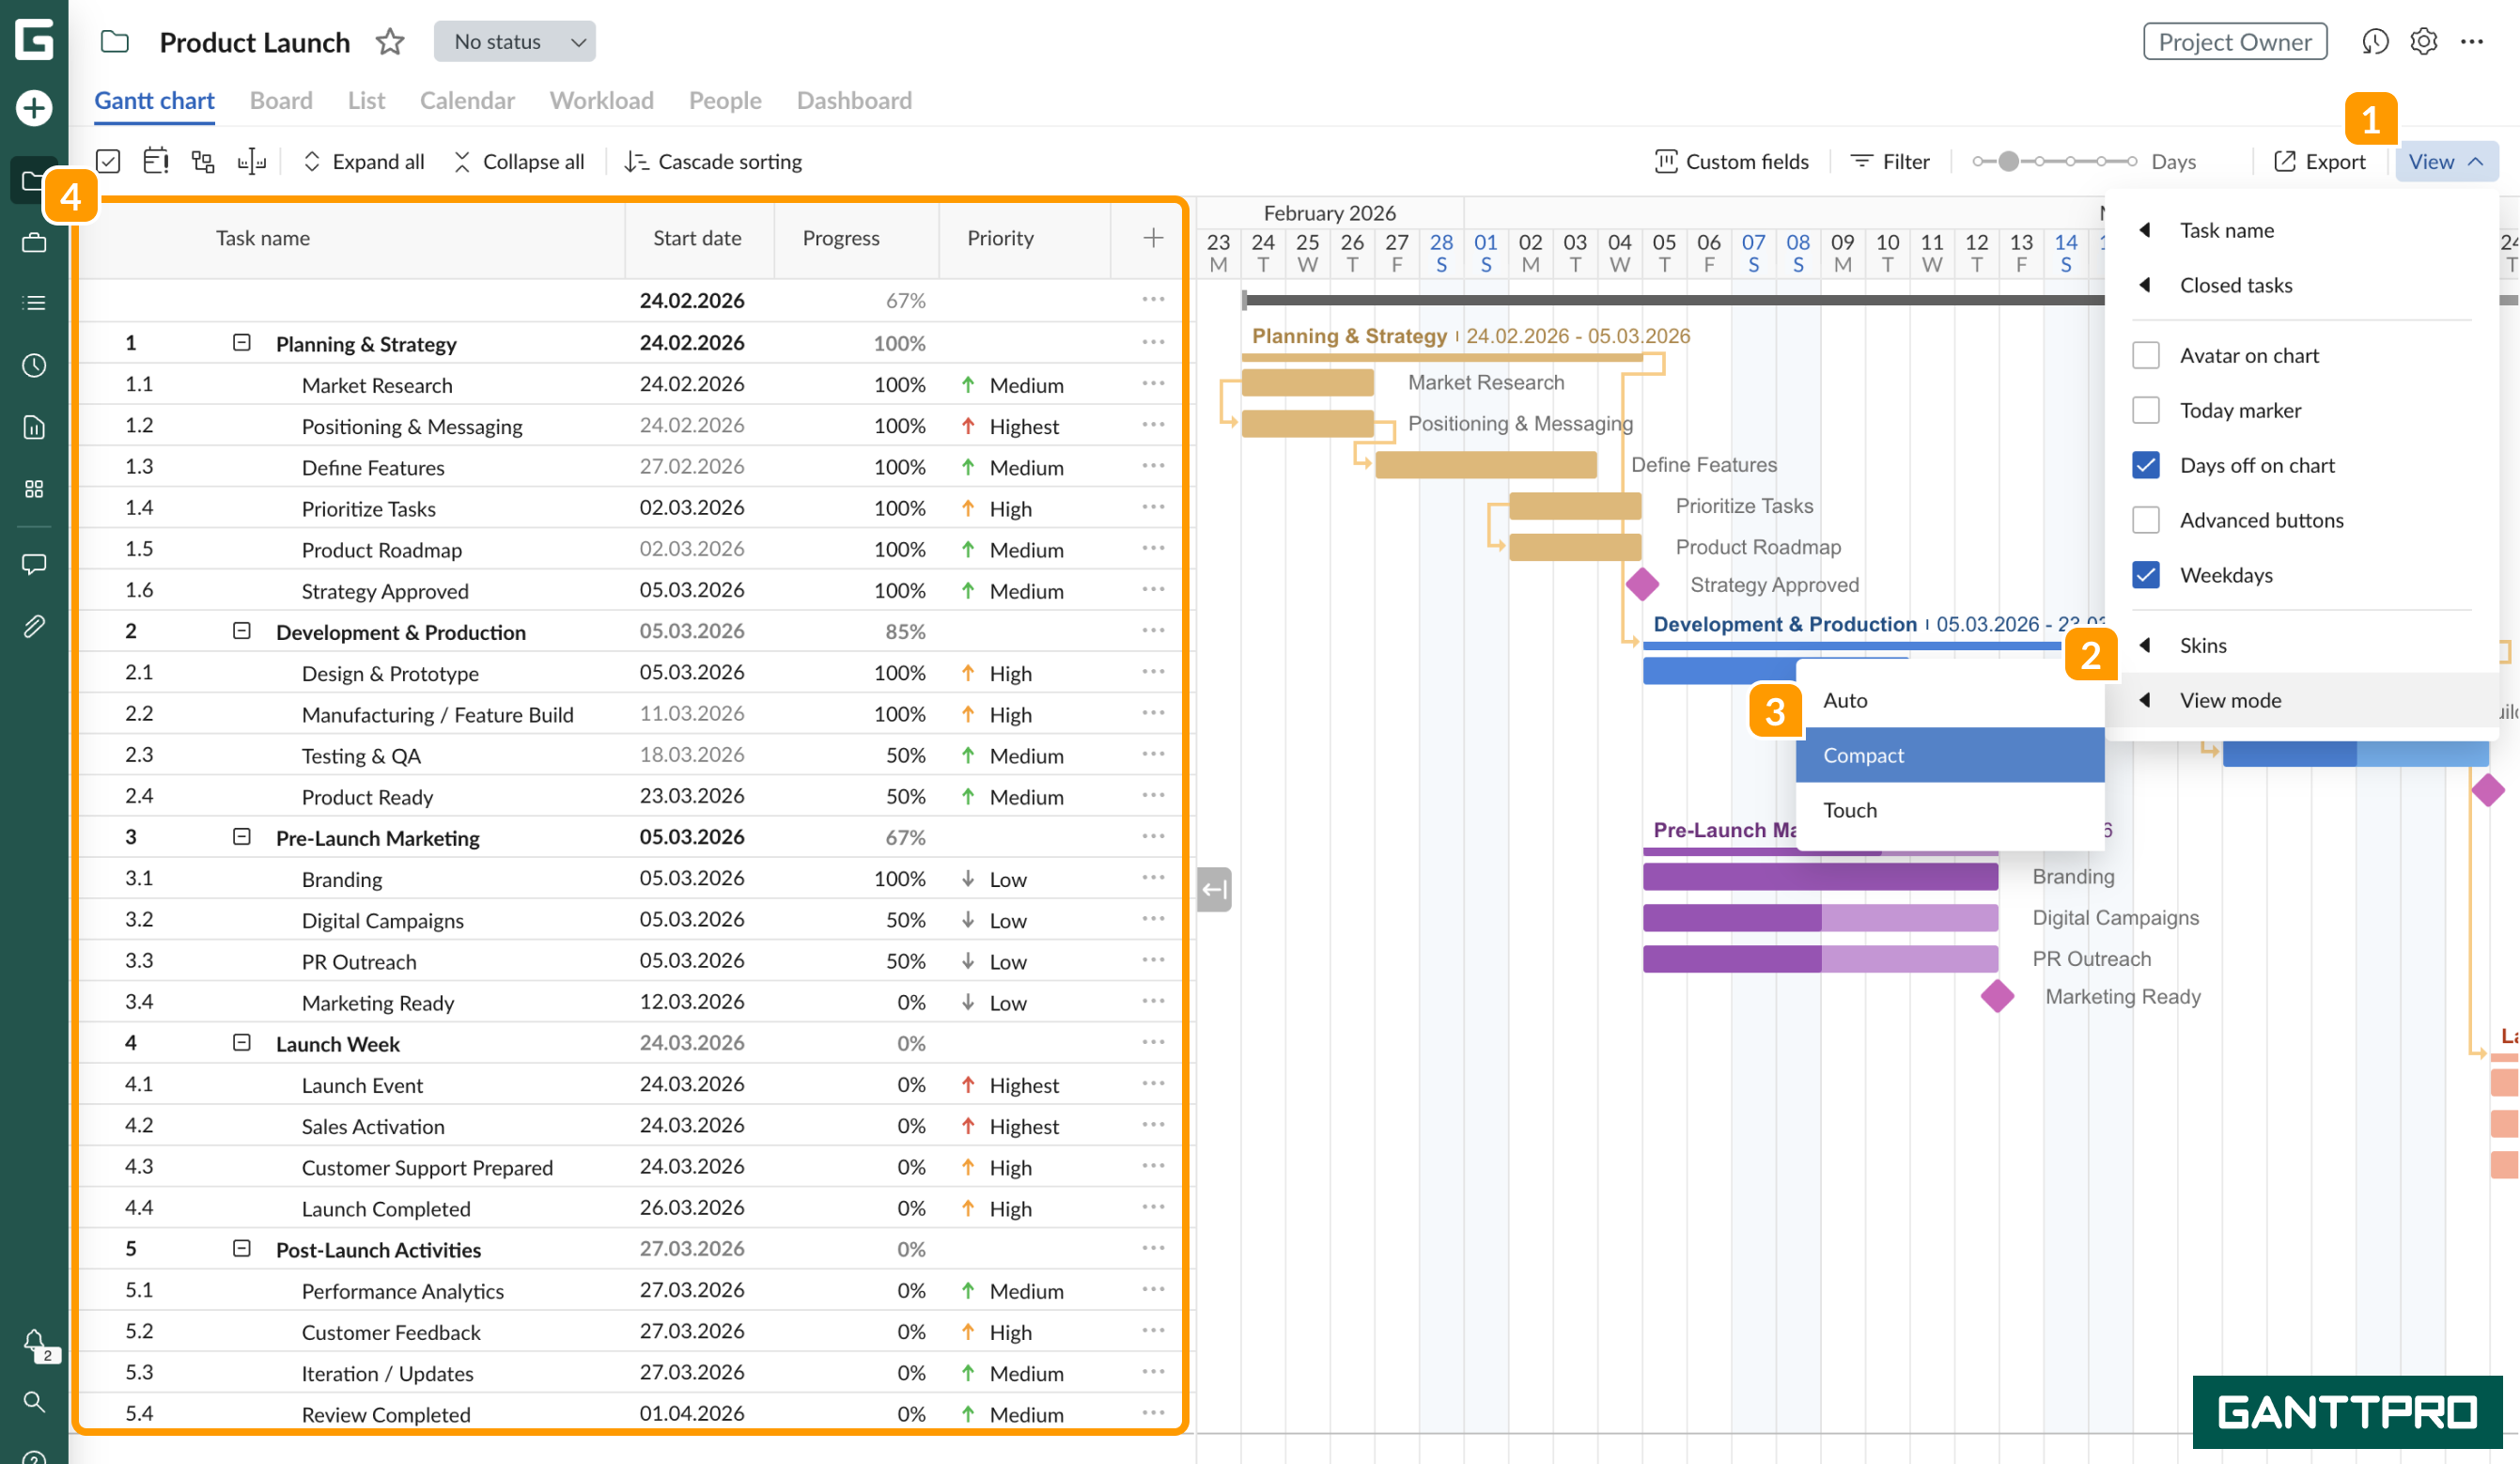
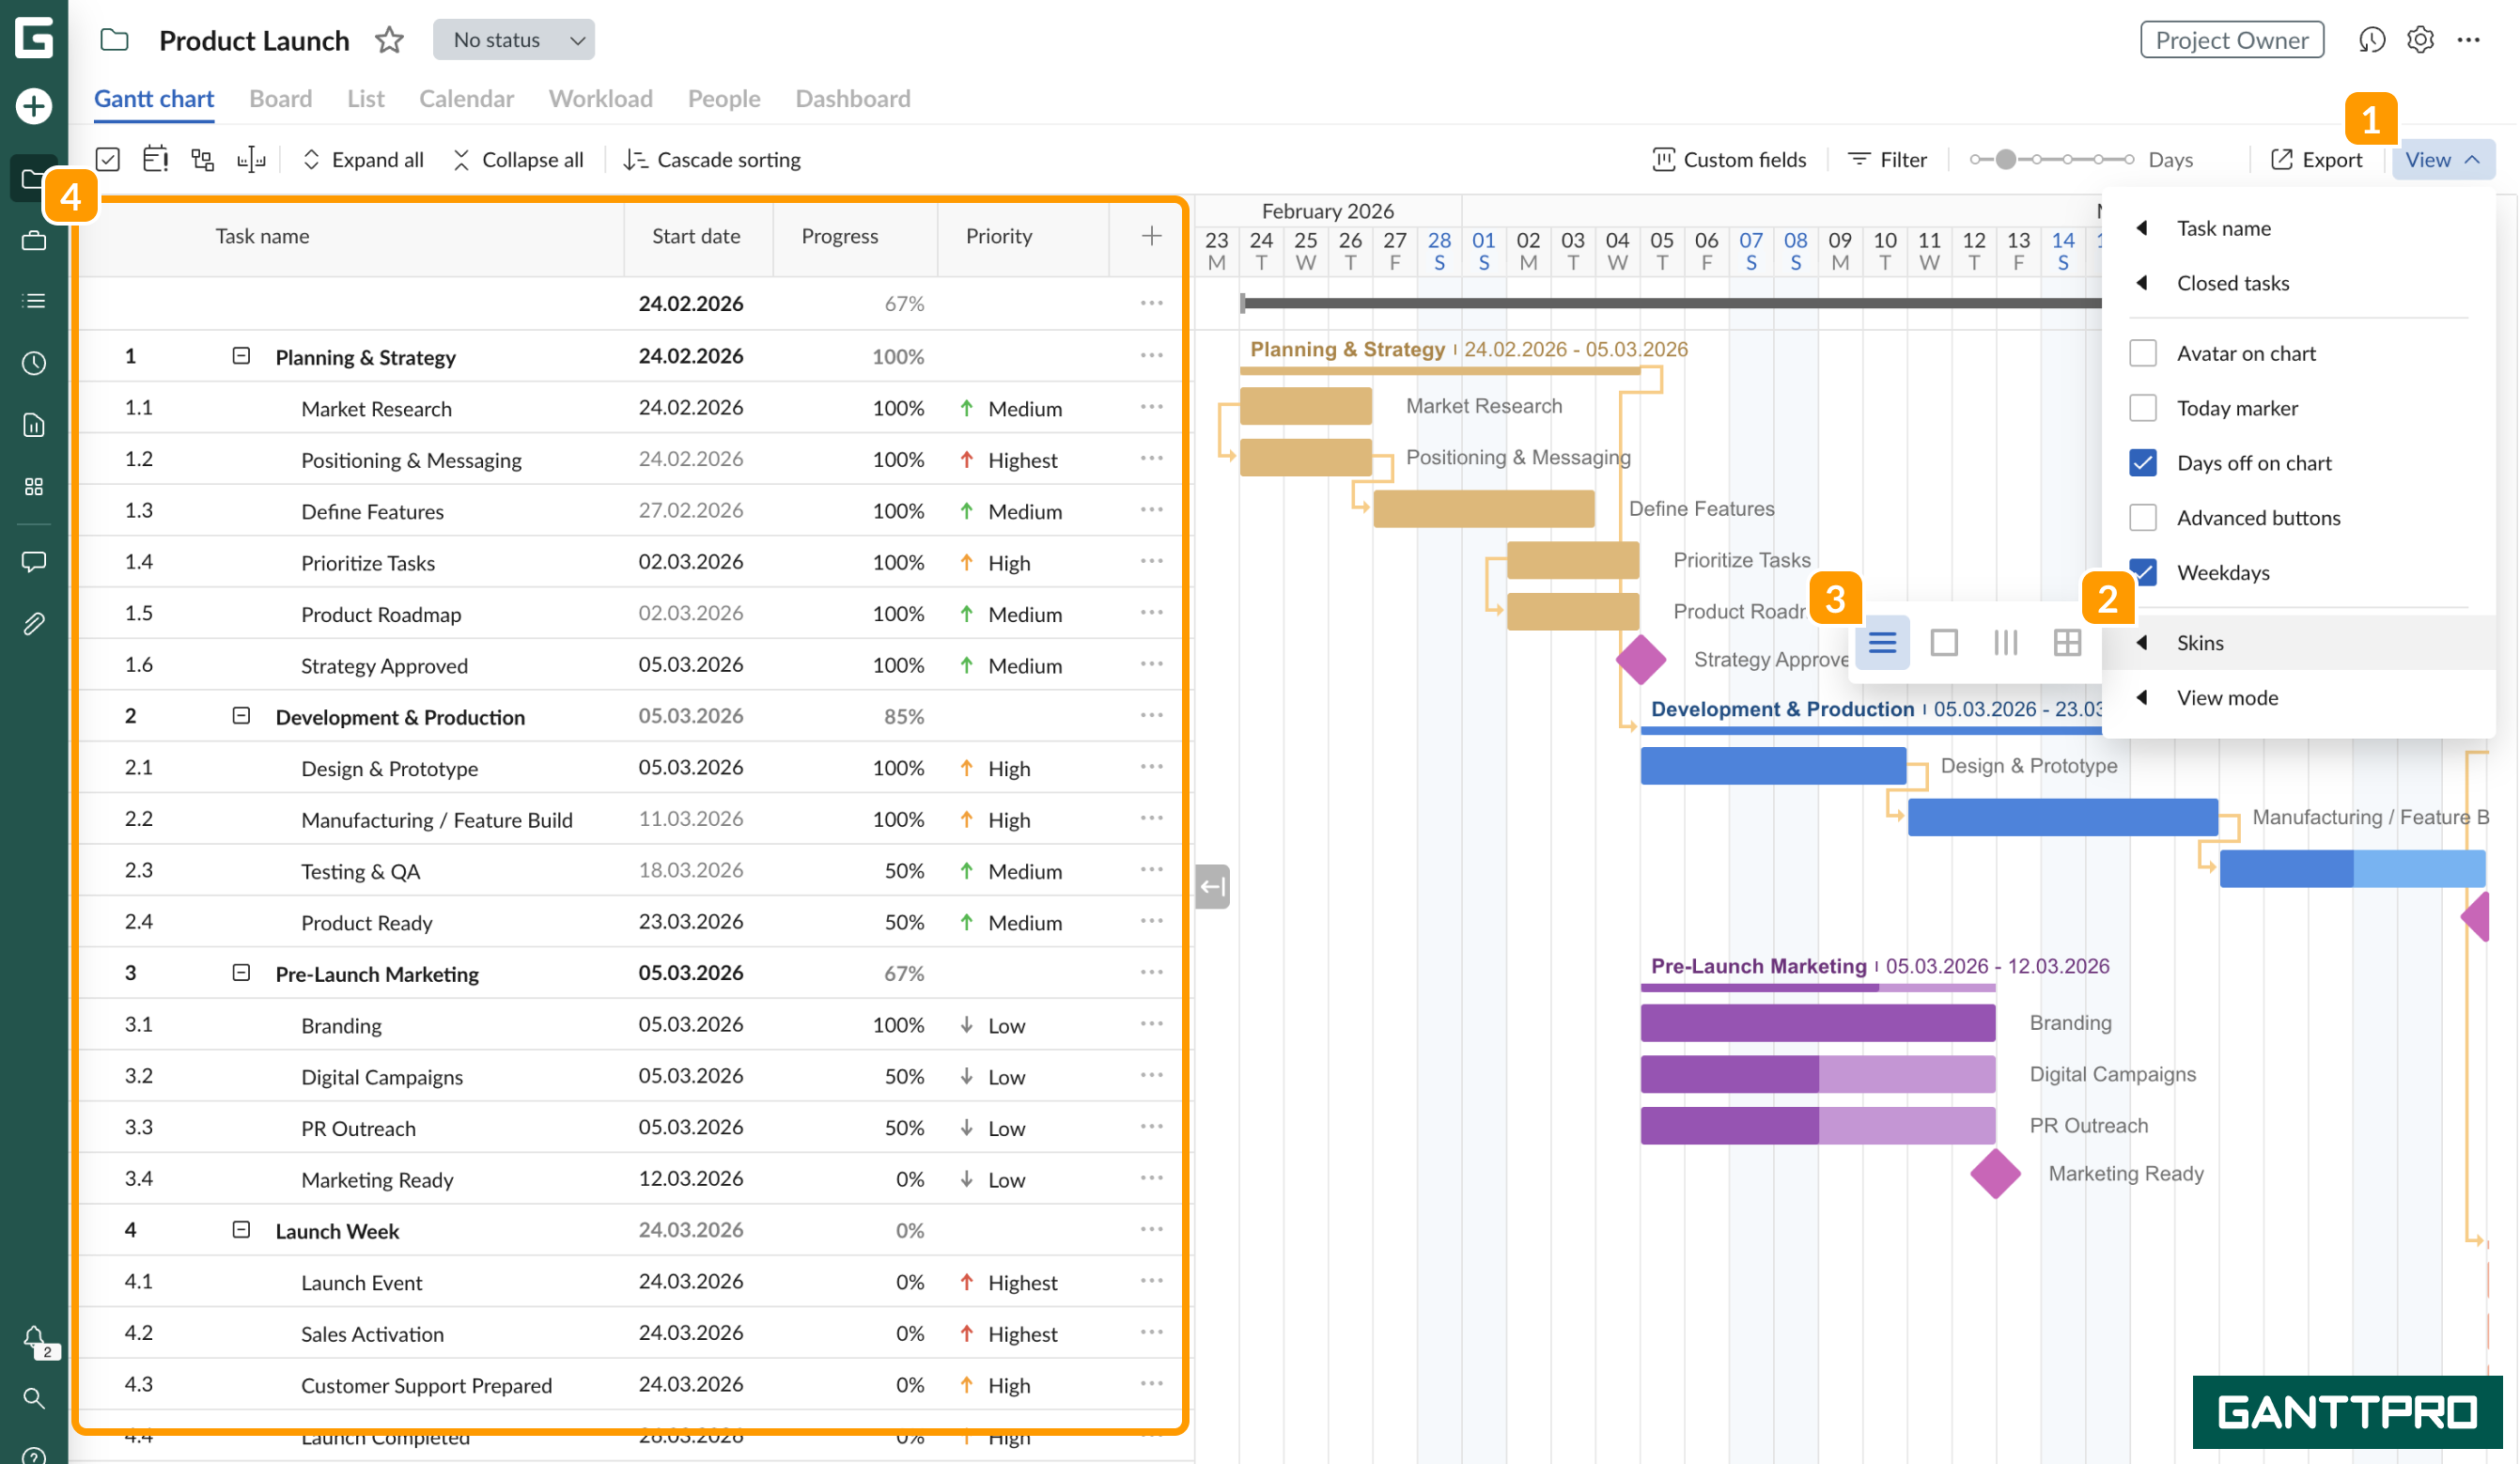
In GanttPRO, every user can adjust a Gantt chart view according to personal preferences. For that, go to the View settings 1 in the upper right corner of the project grid.
A full set of possibilities includes:
- Task name
- Closed tasks
- Avatar on the chart
- Today marker
- Days off on chart
- Advanced buttons
- Weekdays
- Skins
- View mode
Task name
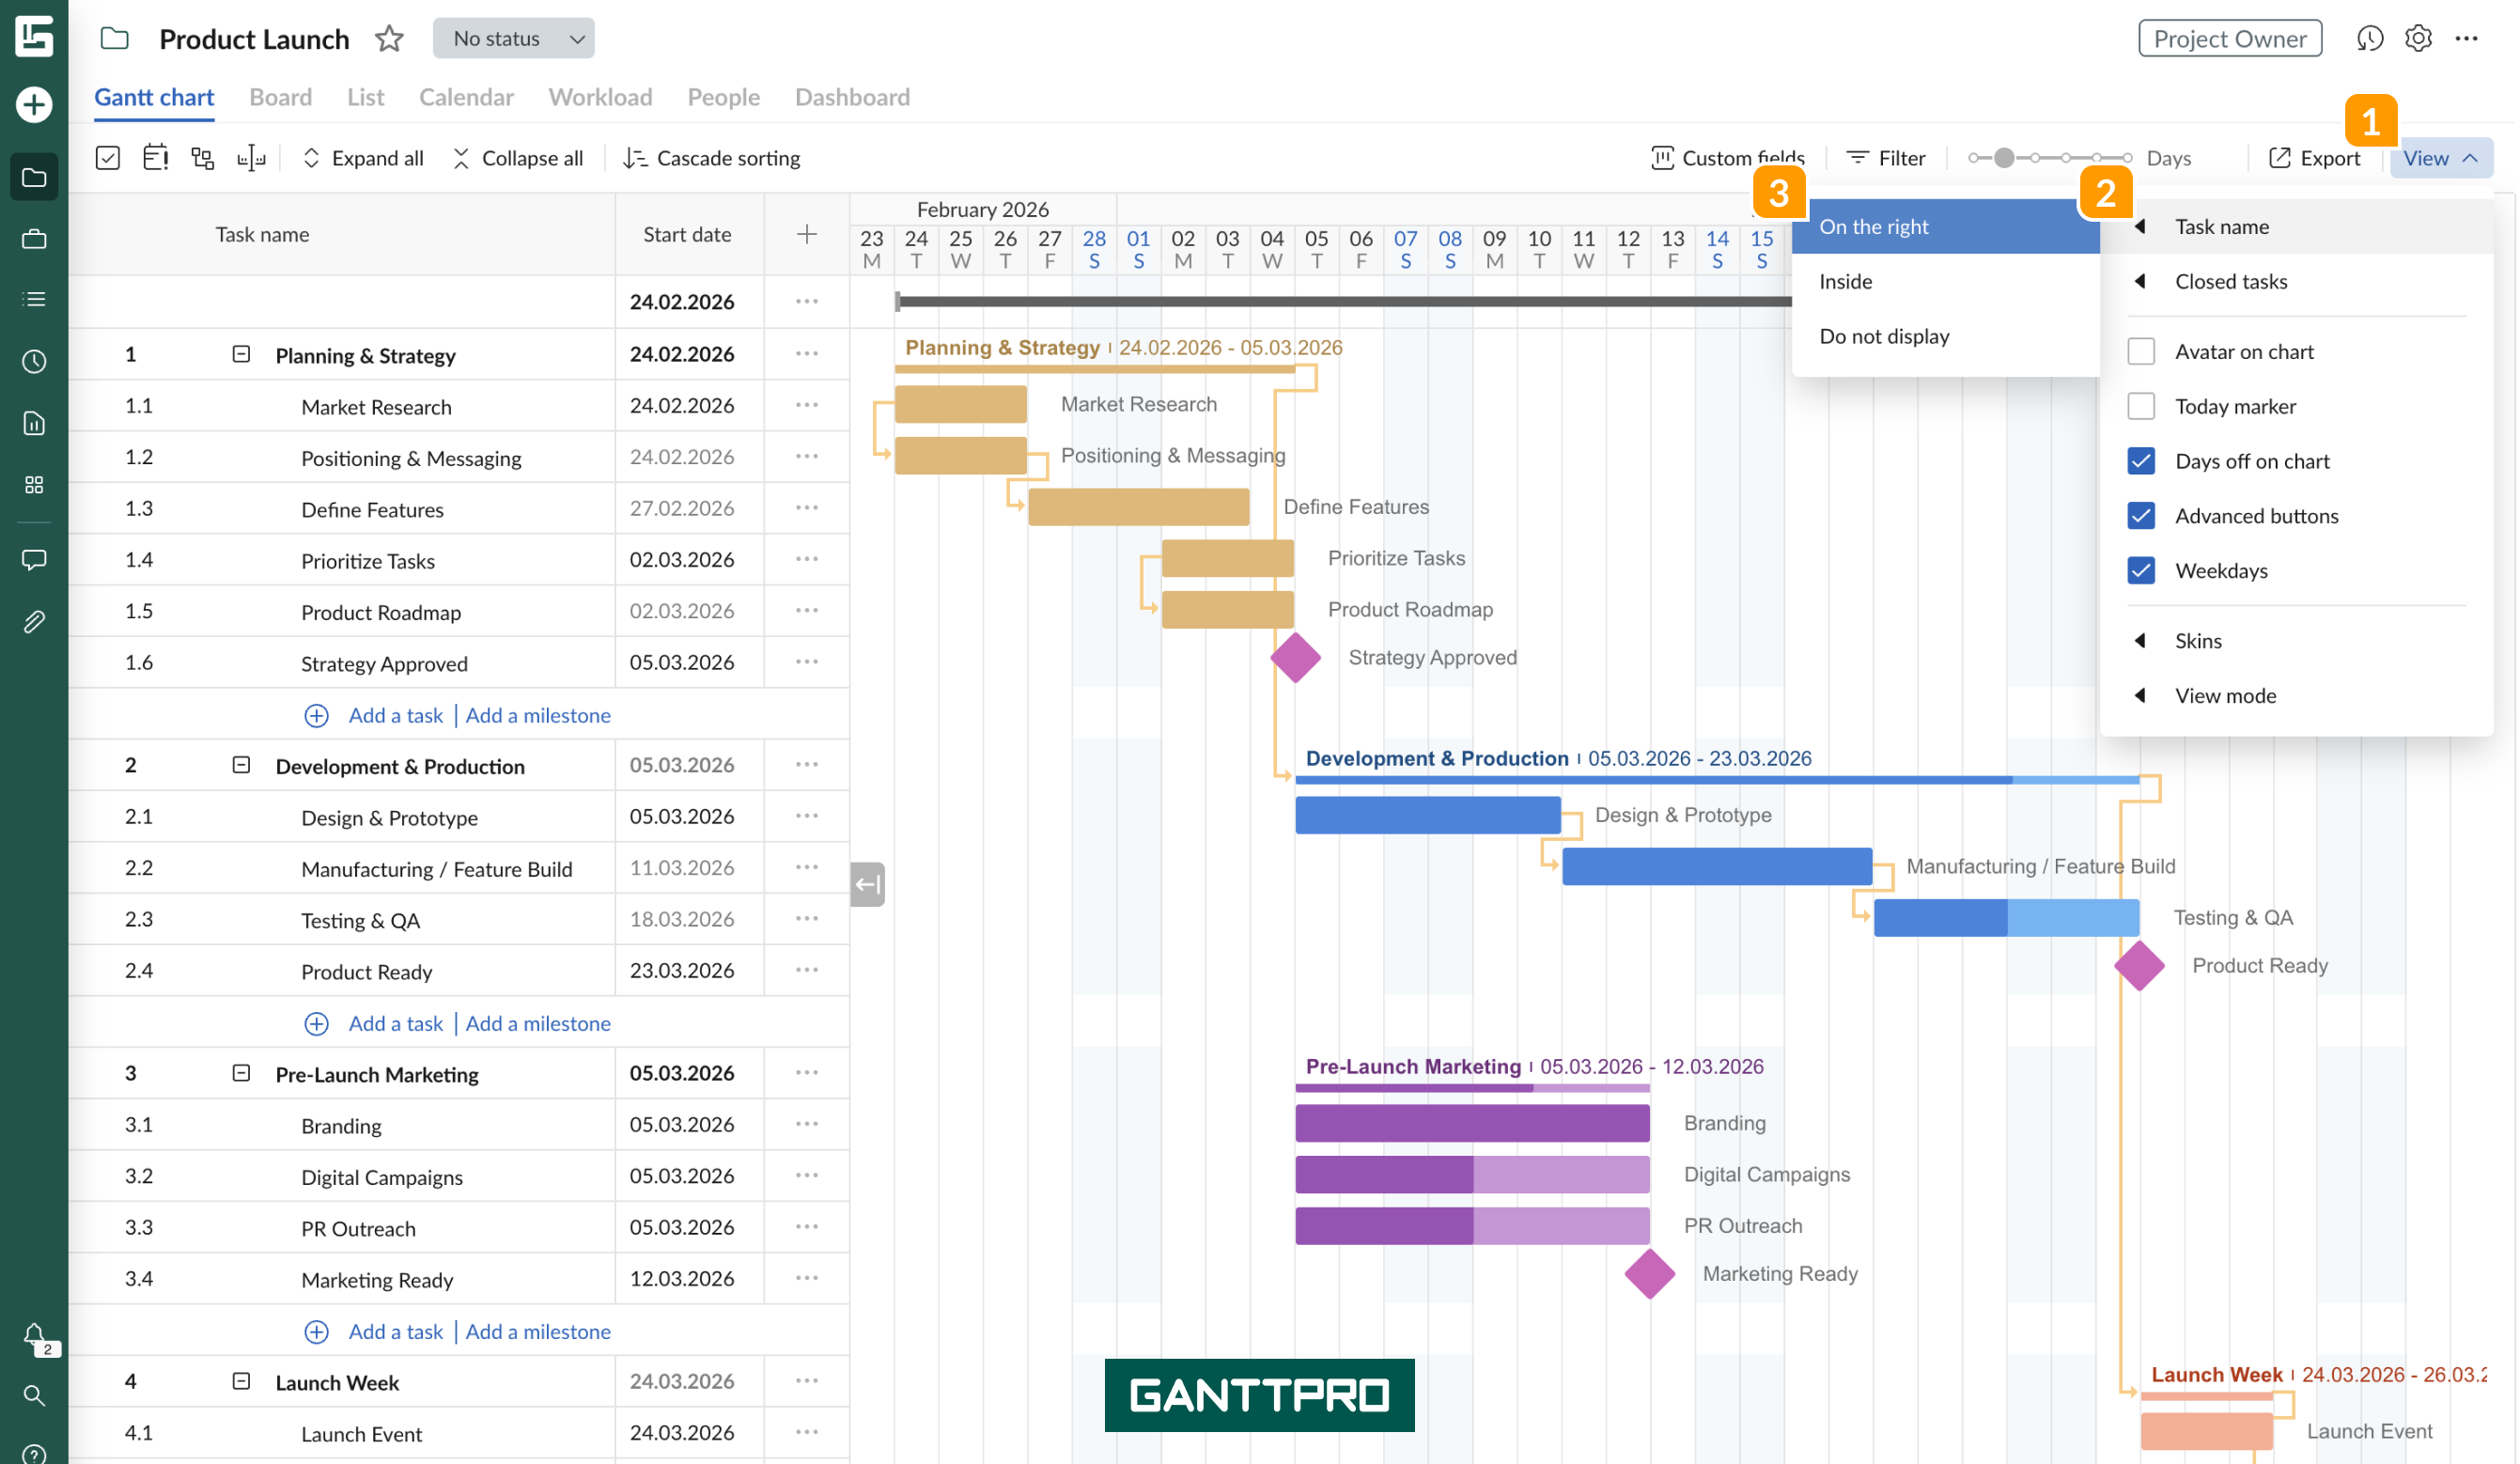
First of all, you can choose how you prefer to see the Task name 2 on the Gantt chart: On the right 3 to the taskbar, Inside the taskbar, or hidden (Do not display option).
Closed tasks
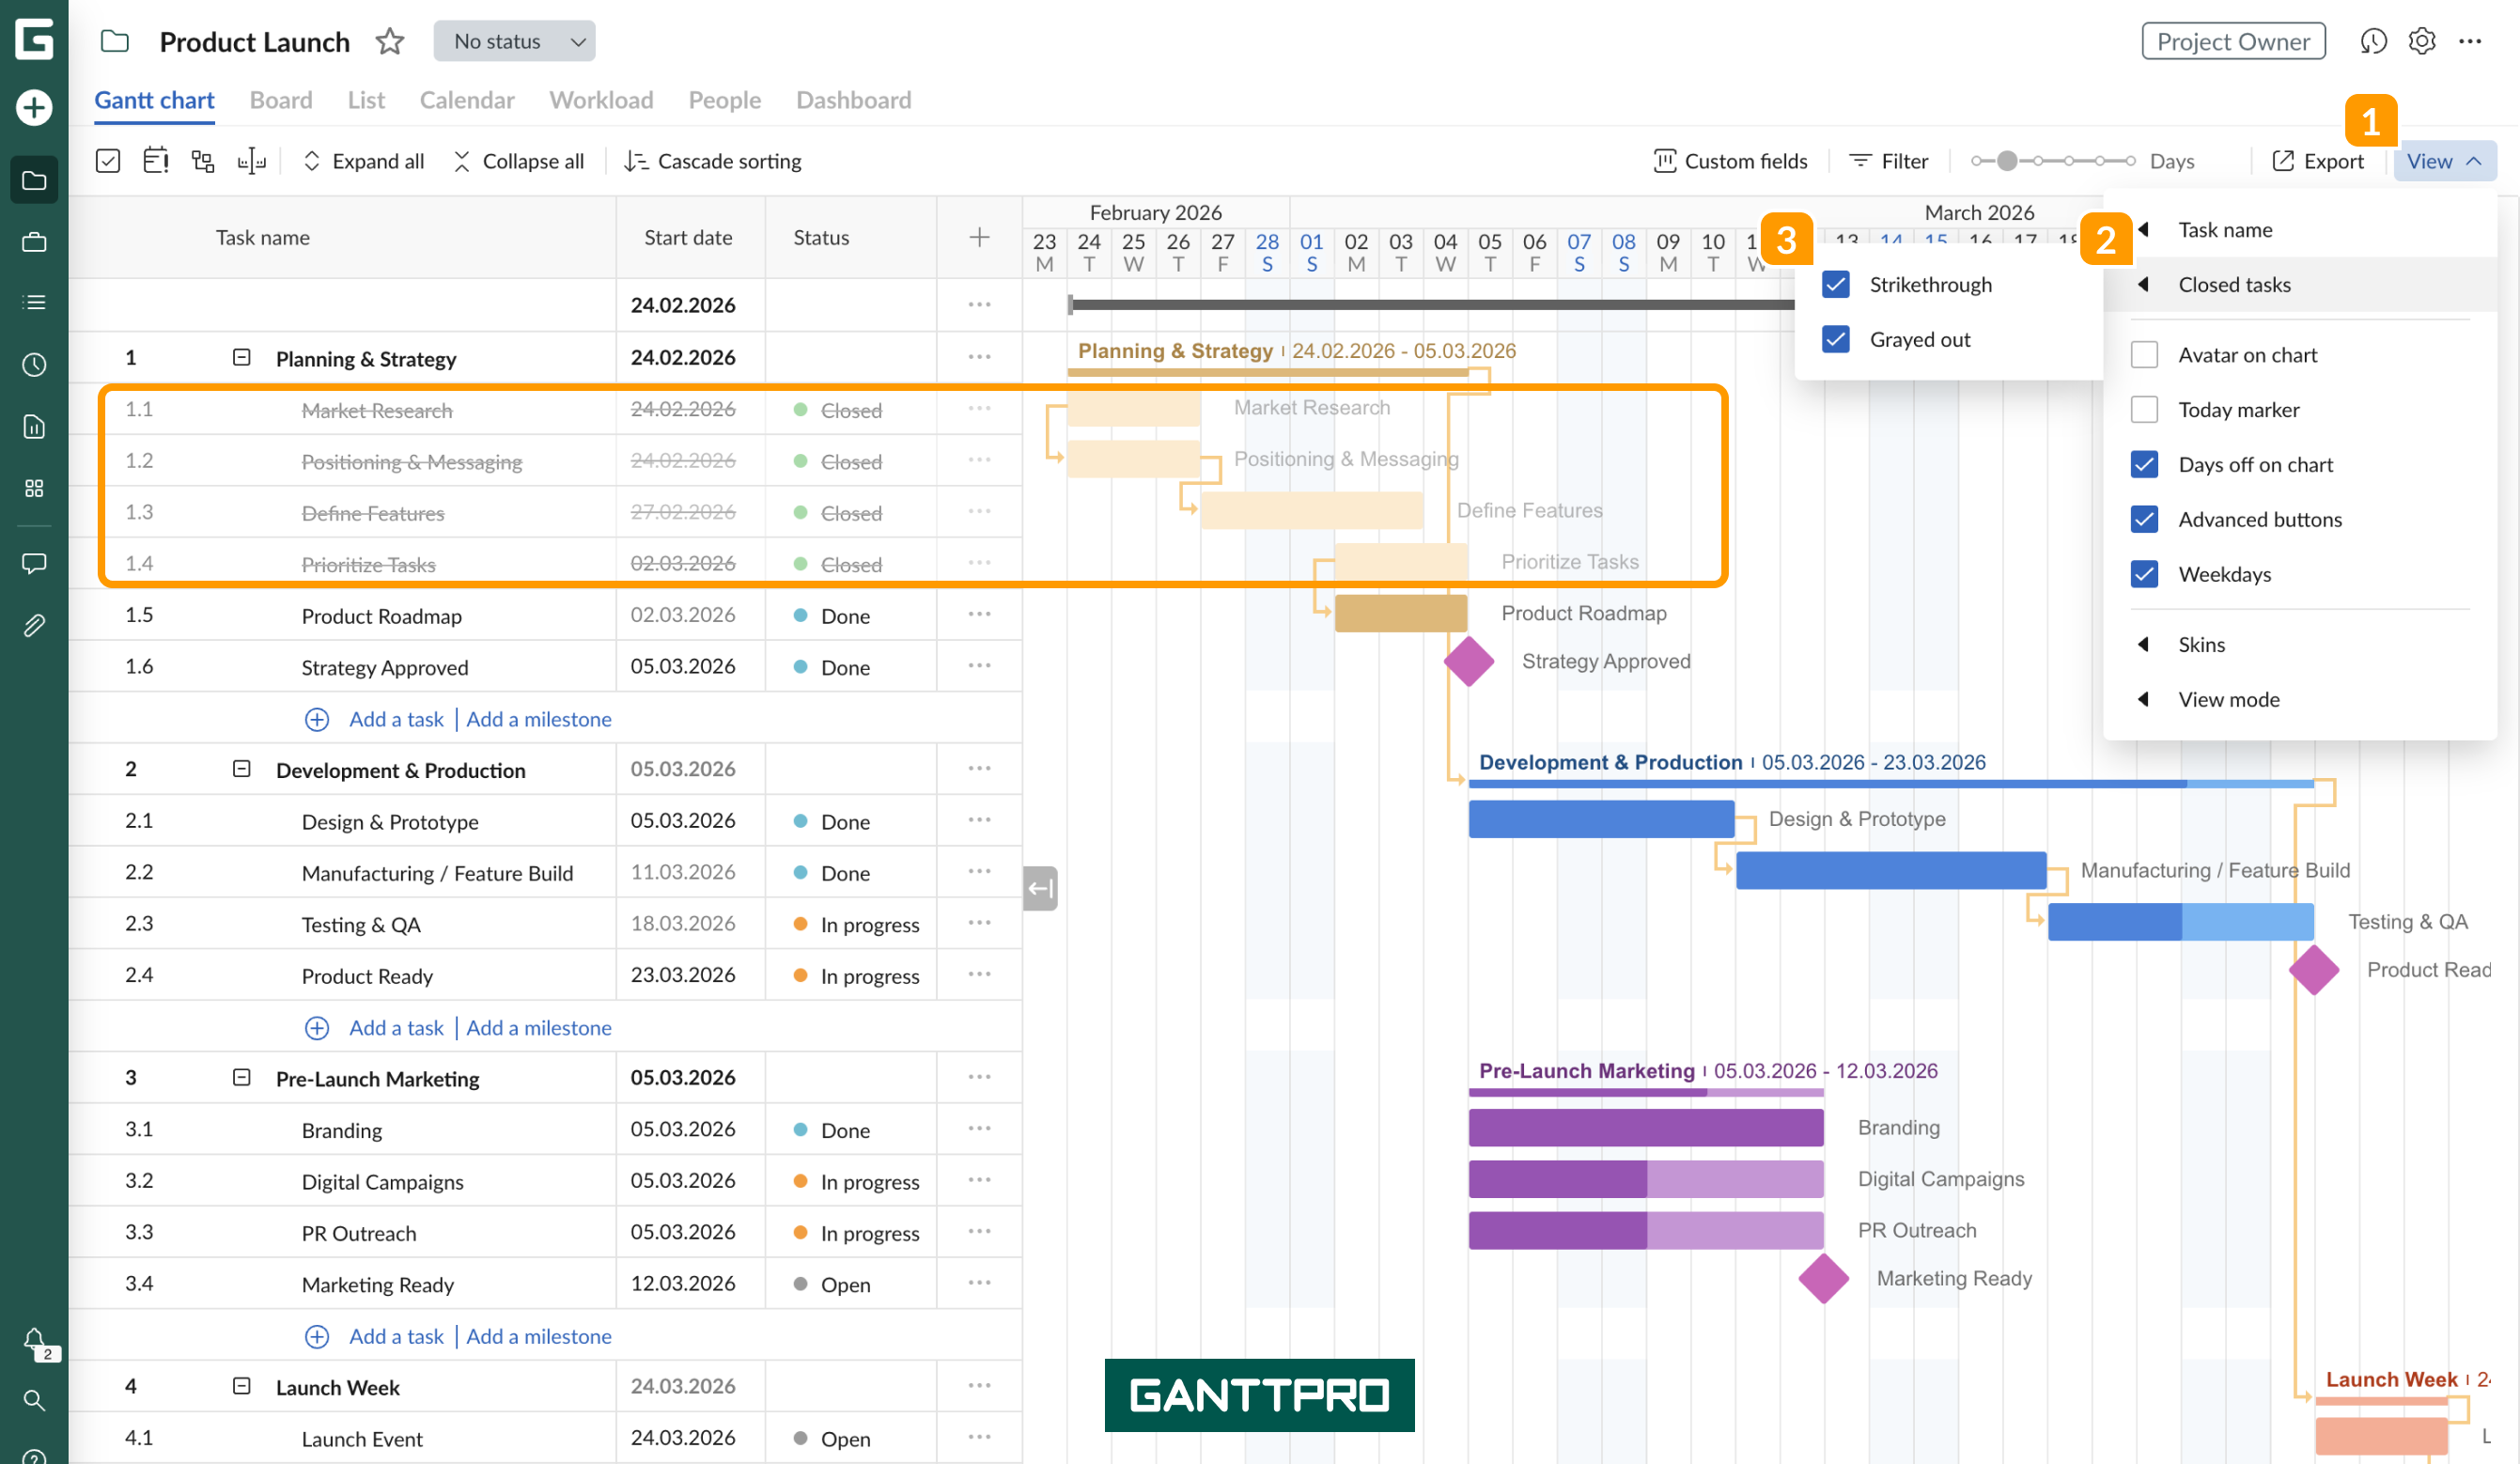
Tasks that have been marked with a Closed status in Task settings or in Standard fields on a project grid, can be displayed in several ways for better visualization. In the View settings 1, click on Closed tasks 2 and choose between two options 3: Strikethrough or Grayed out. You can select only one, have two at the same time or have none at all.
Strikethrough will be applied to a task list, while Grayed out will be shown both in a task list and on a Gantt chart. In this case, the color of task bars with the “Closed” status will be faded.
Avatar on chart
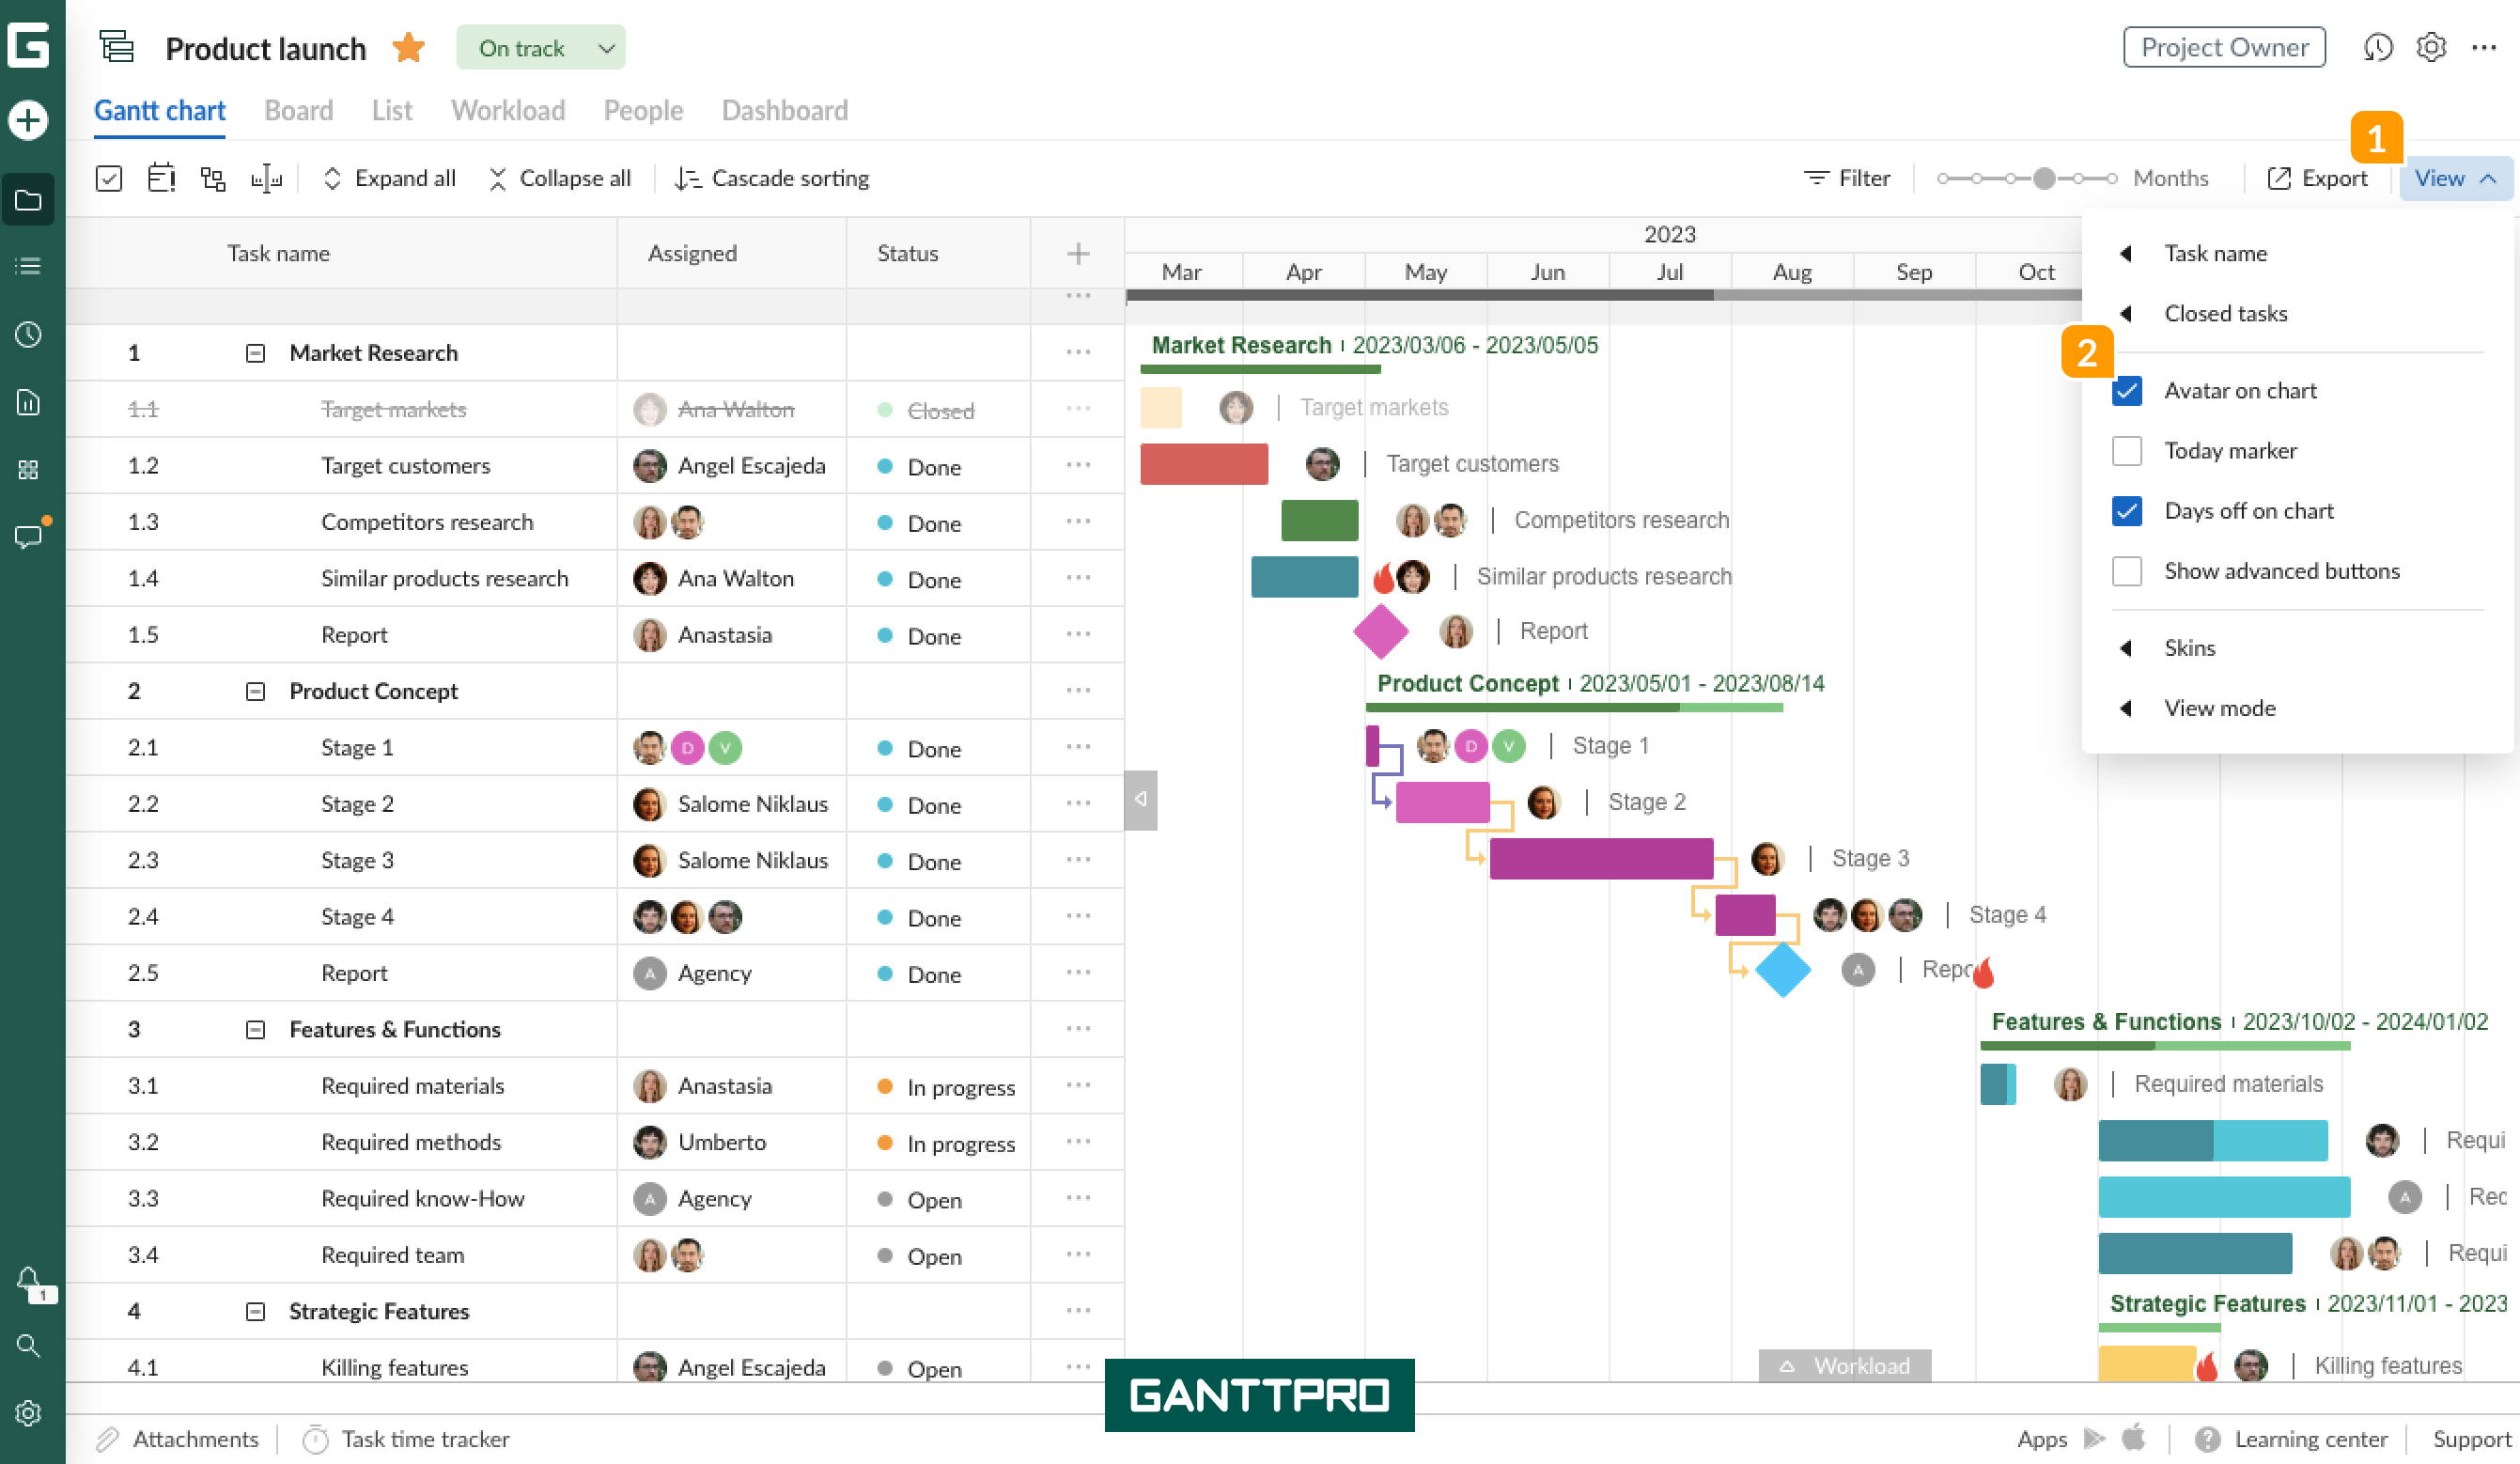
You can enable Avatar on chart 2 to quickly see on the Gantt chart who is assigned to a task, and disable it when not needed.
Today marker
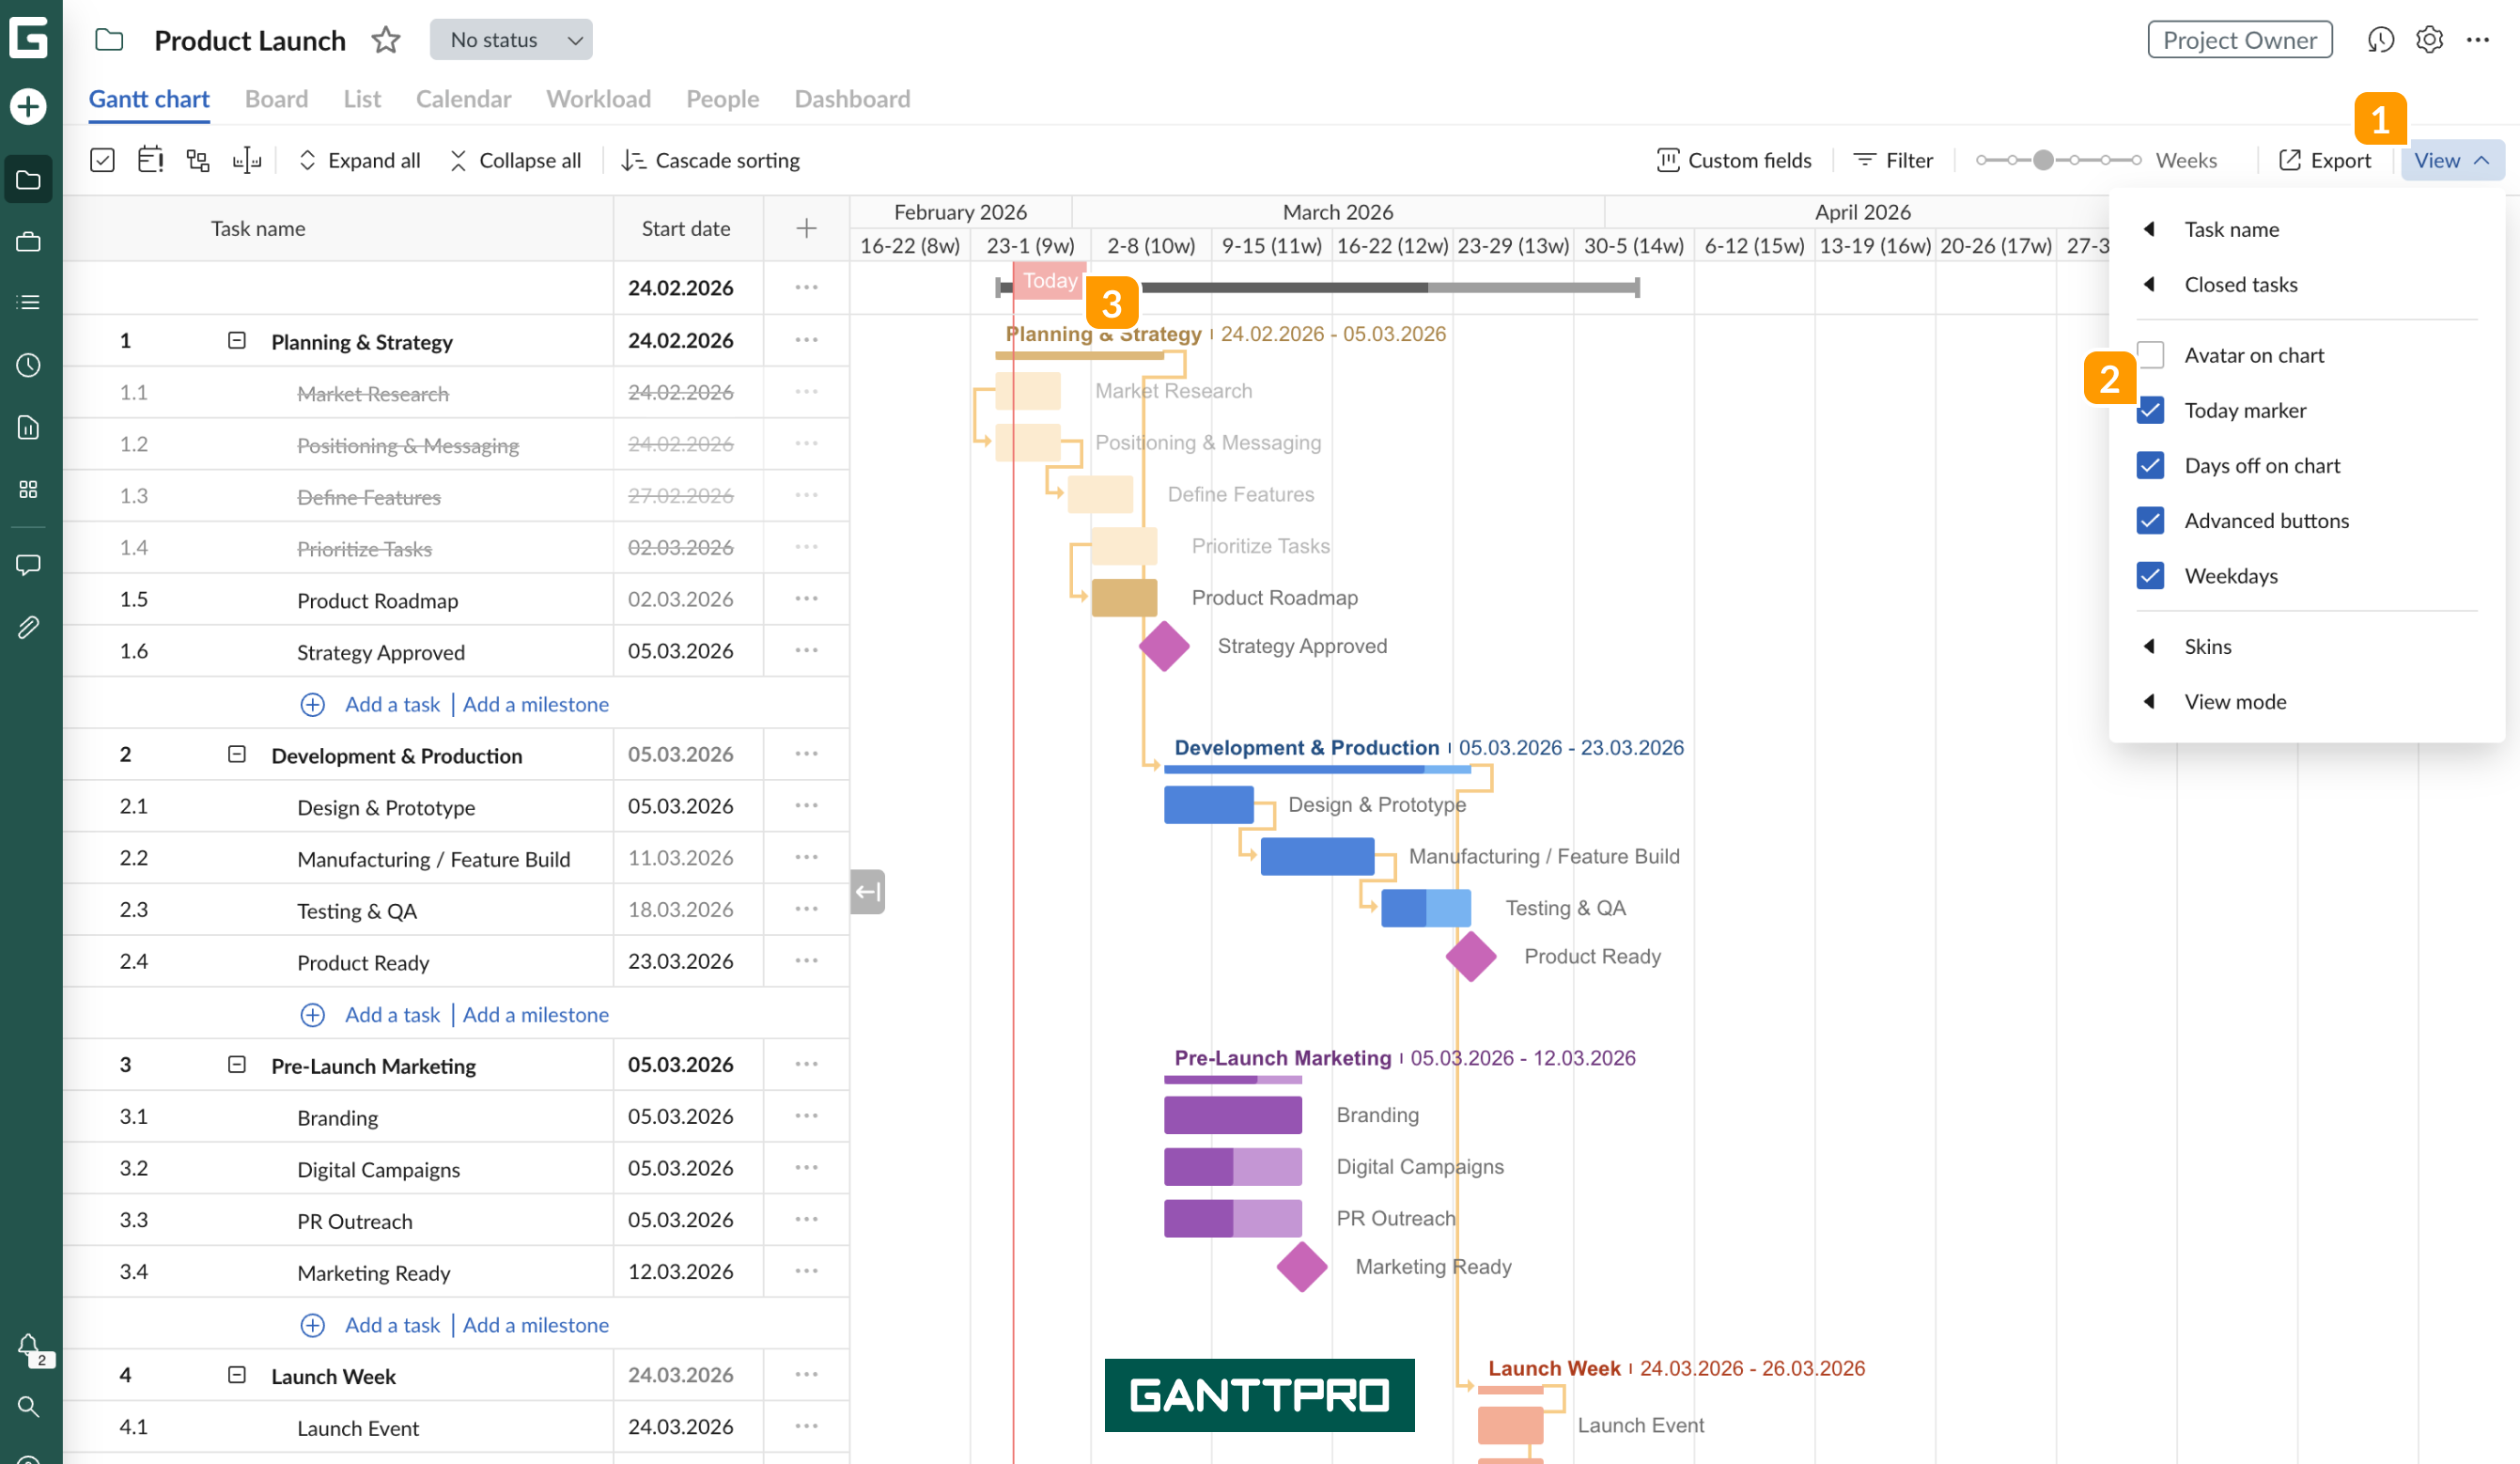
Turning on the Today marker 2, which is a red line indicating the current day, you can more easily see current tasks and the progress made in the project.
Days off on chart
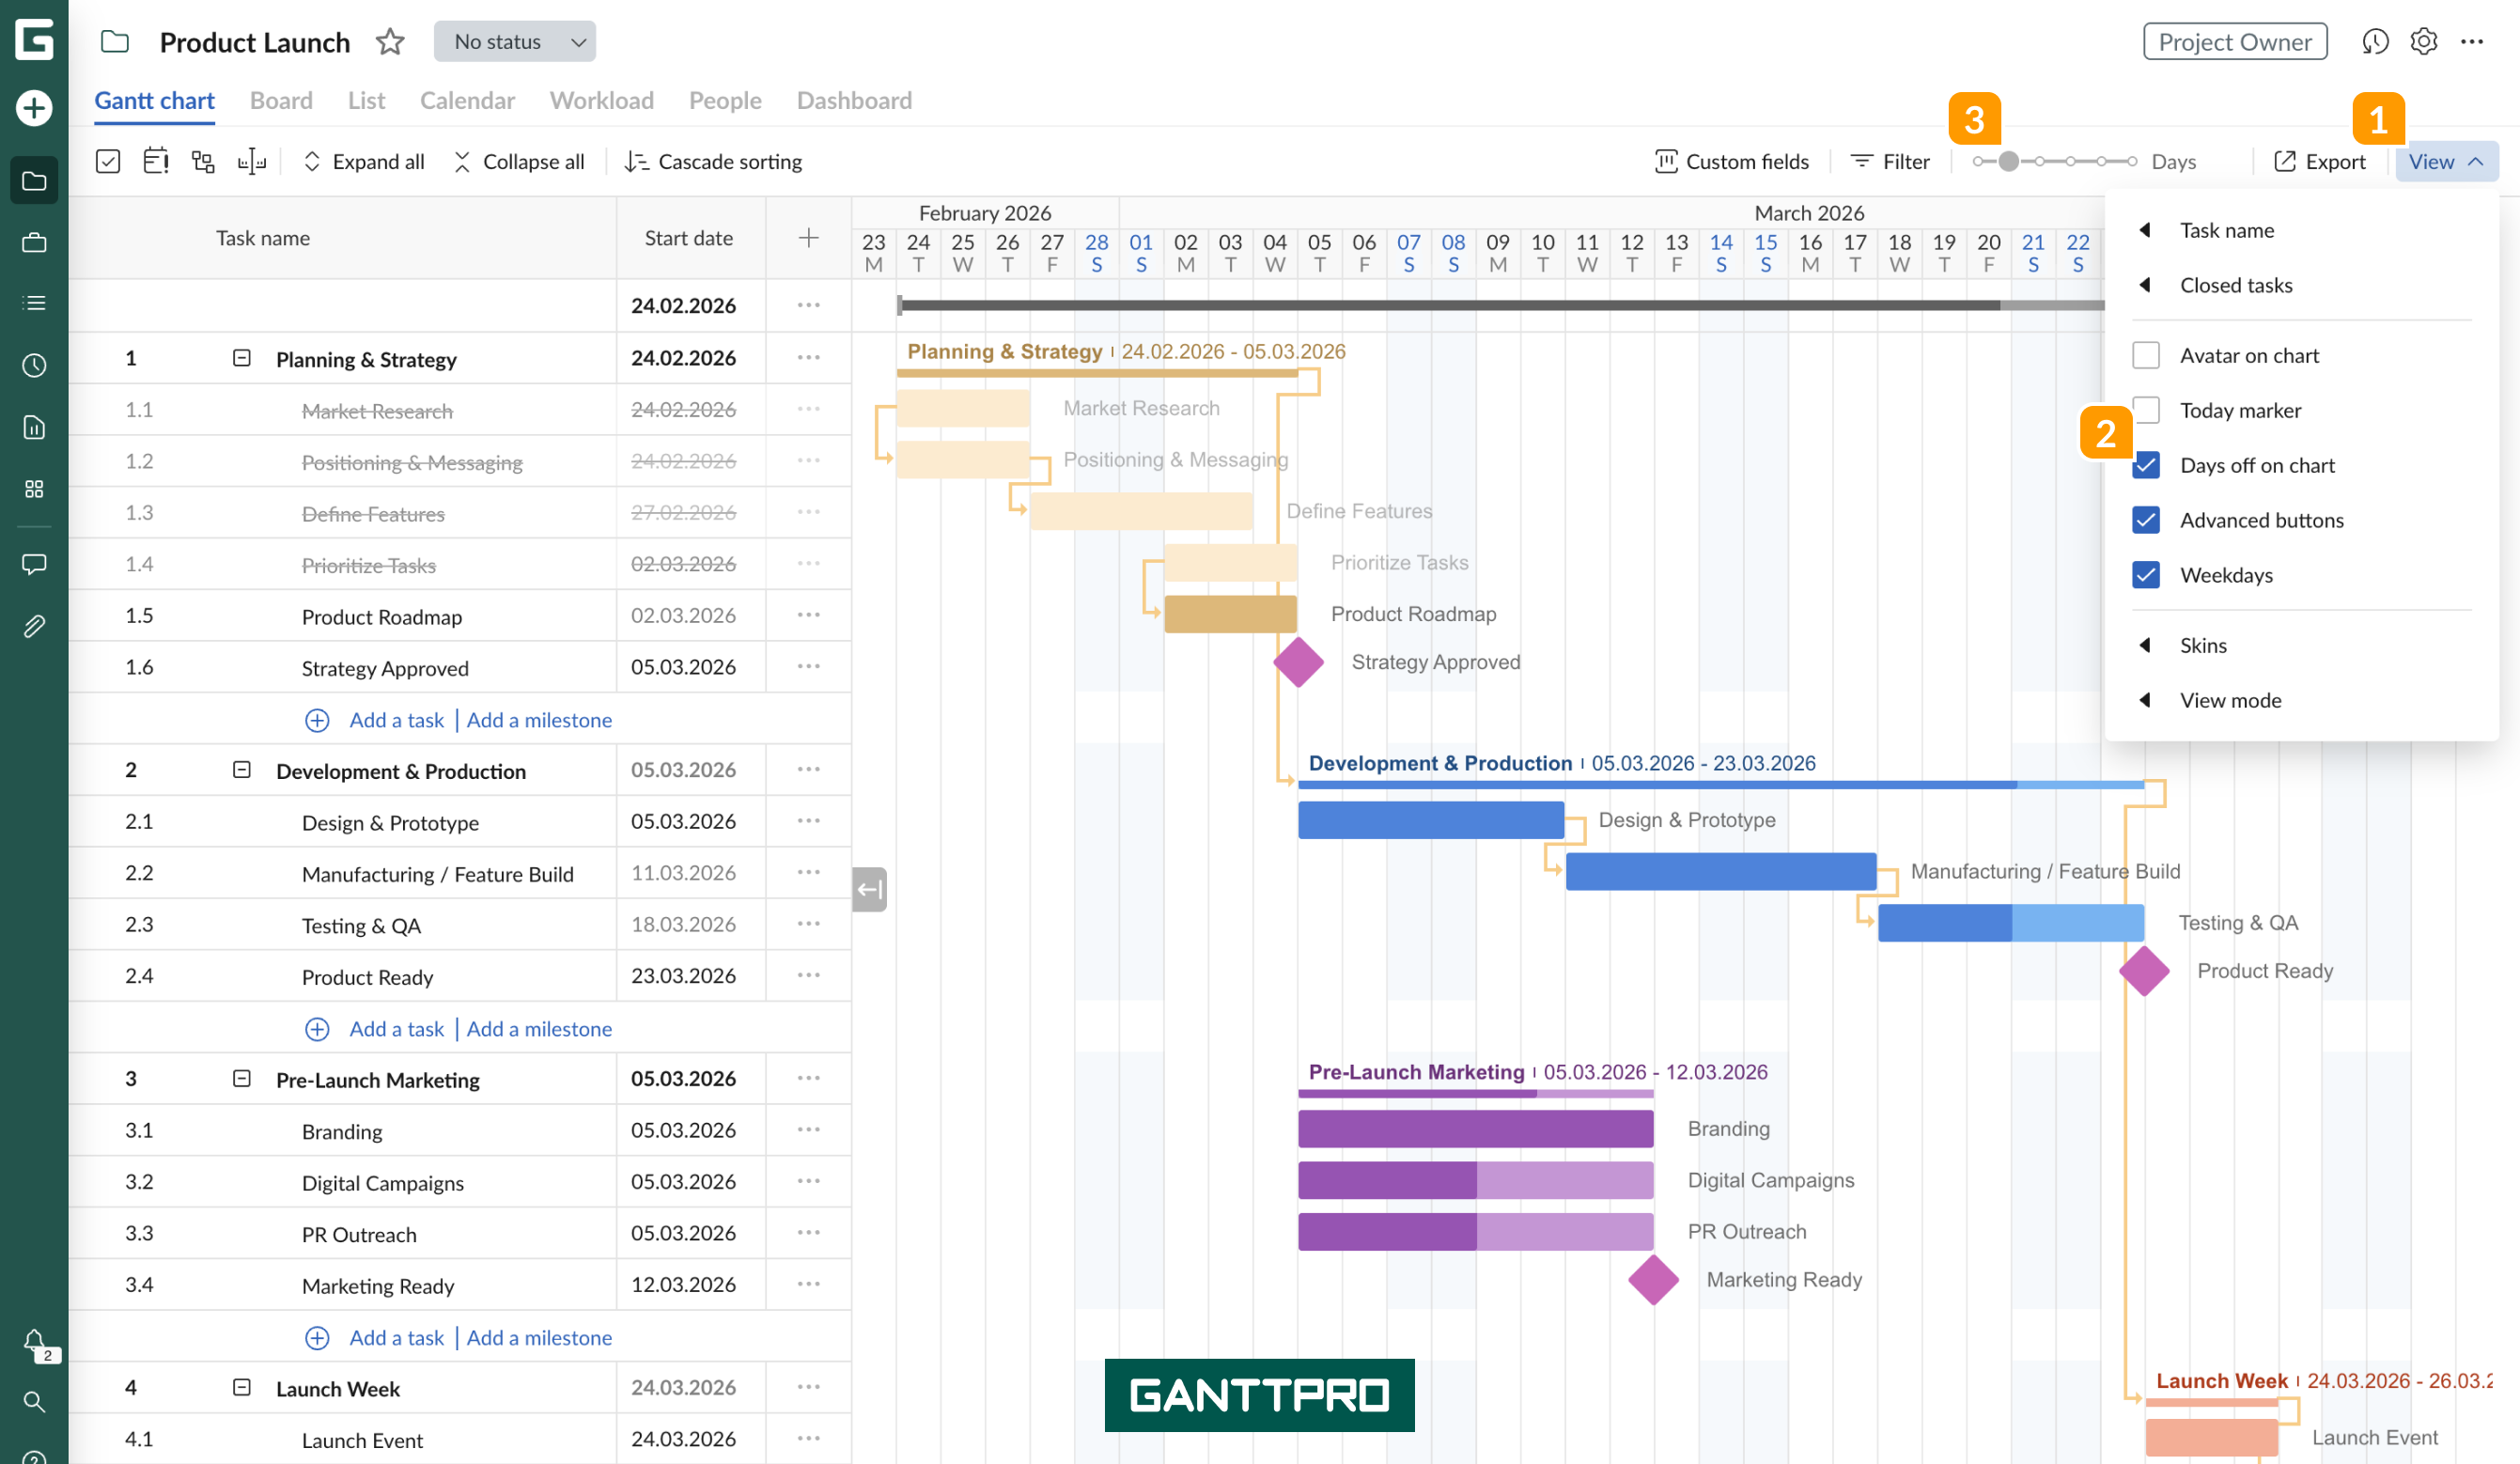
You can also choose whether you want to see the days off on the Gantt chart timeline. By default, the timeline shows only weekdays. To see the days off on your Chart, check the box Days off on chart 2.
Remember to adjust the timeline for that using Zoom 3, as you can only see the days on the timeline when Zoom is set to days.
Show advanced buttons
Check the box for Show advanced buttons 2 to have the possibility to quickly add a task or a milestone on the grid 3, or uncheck it if you need to save some space. 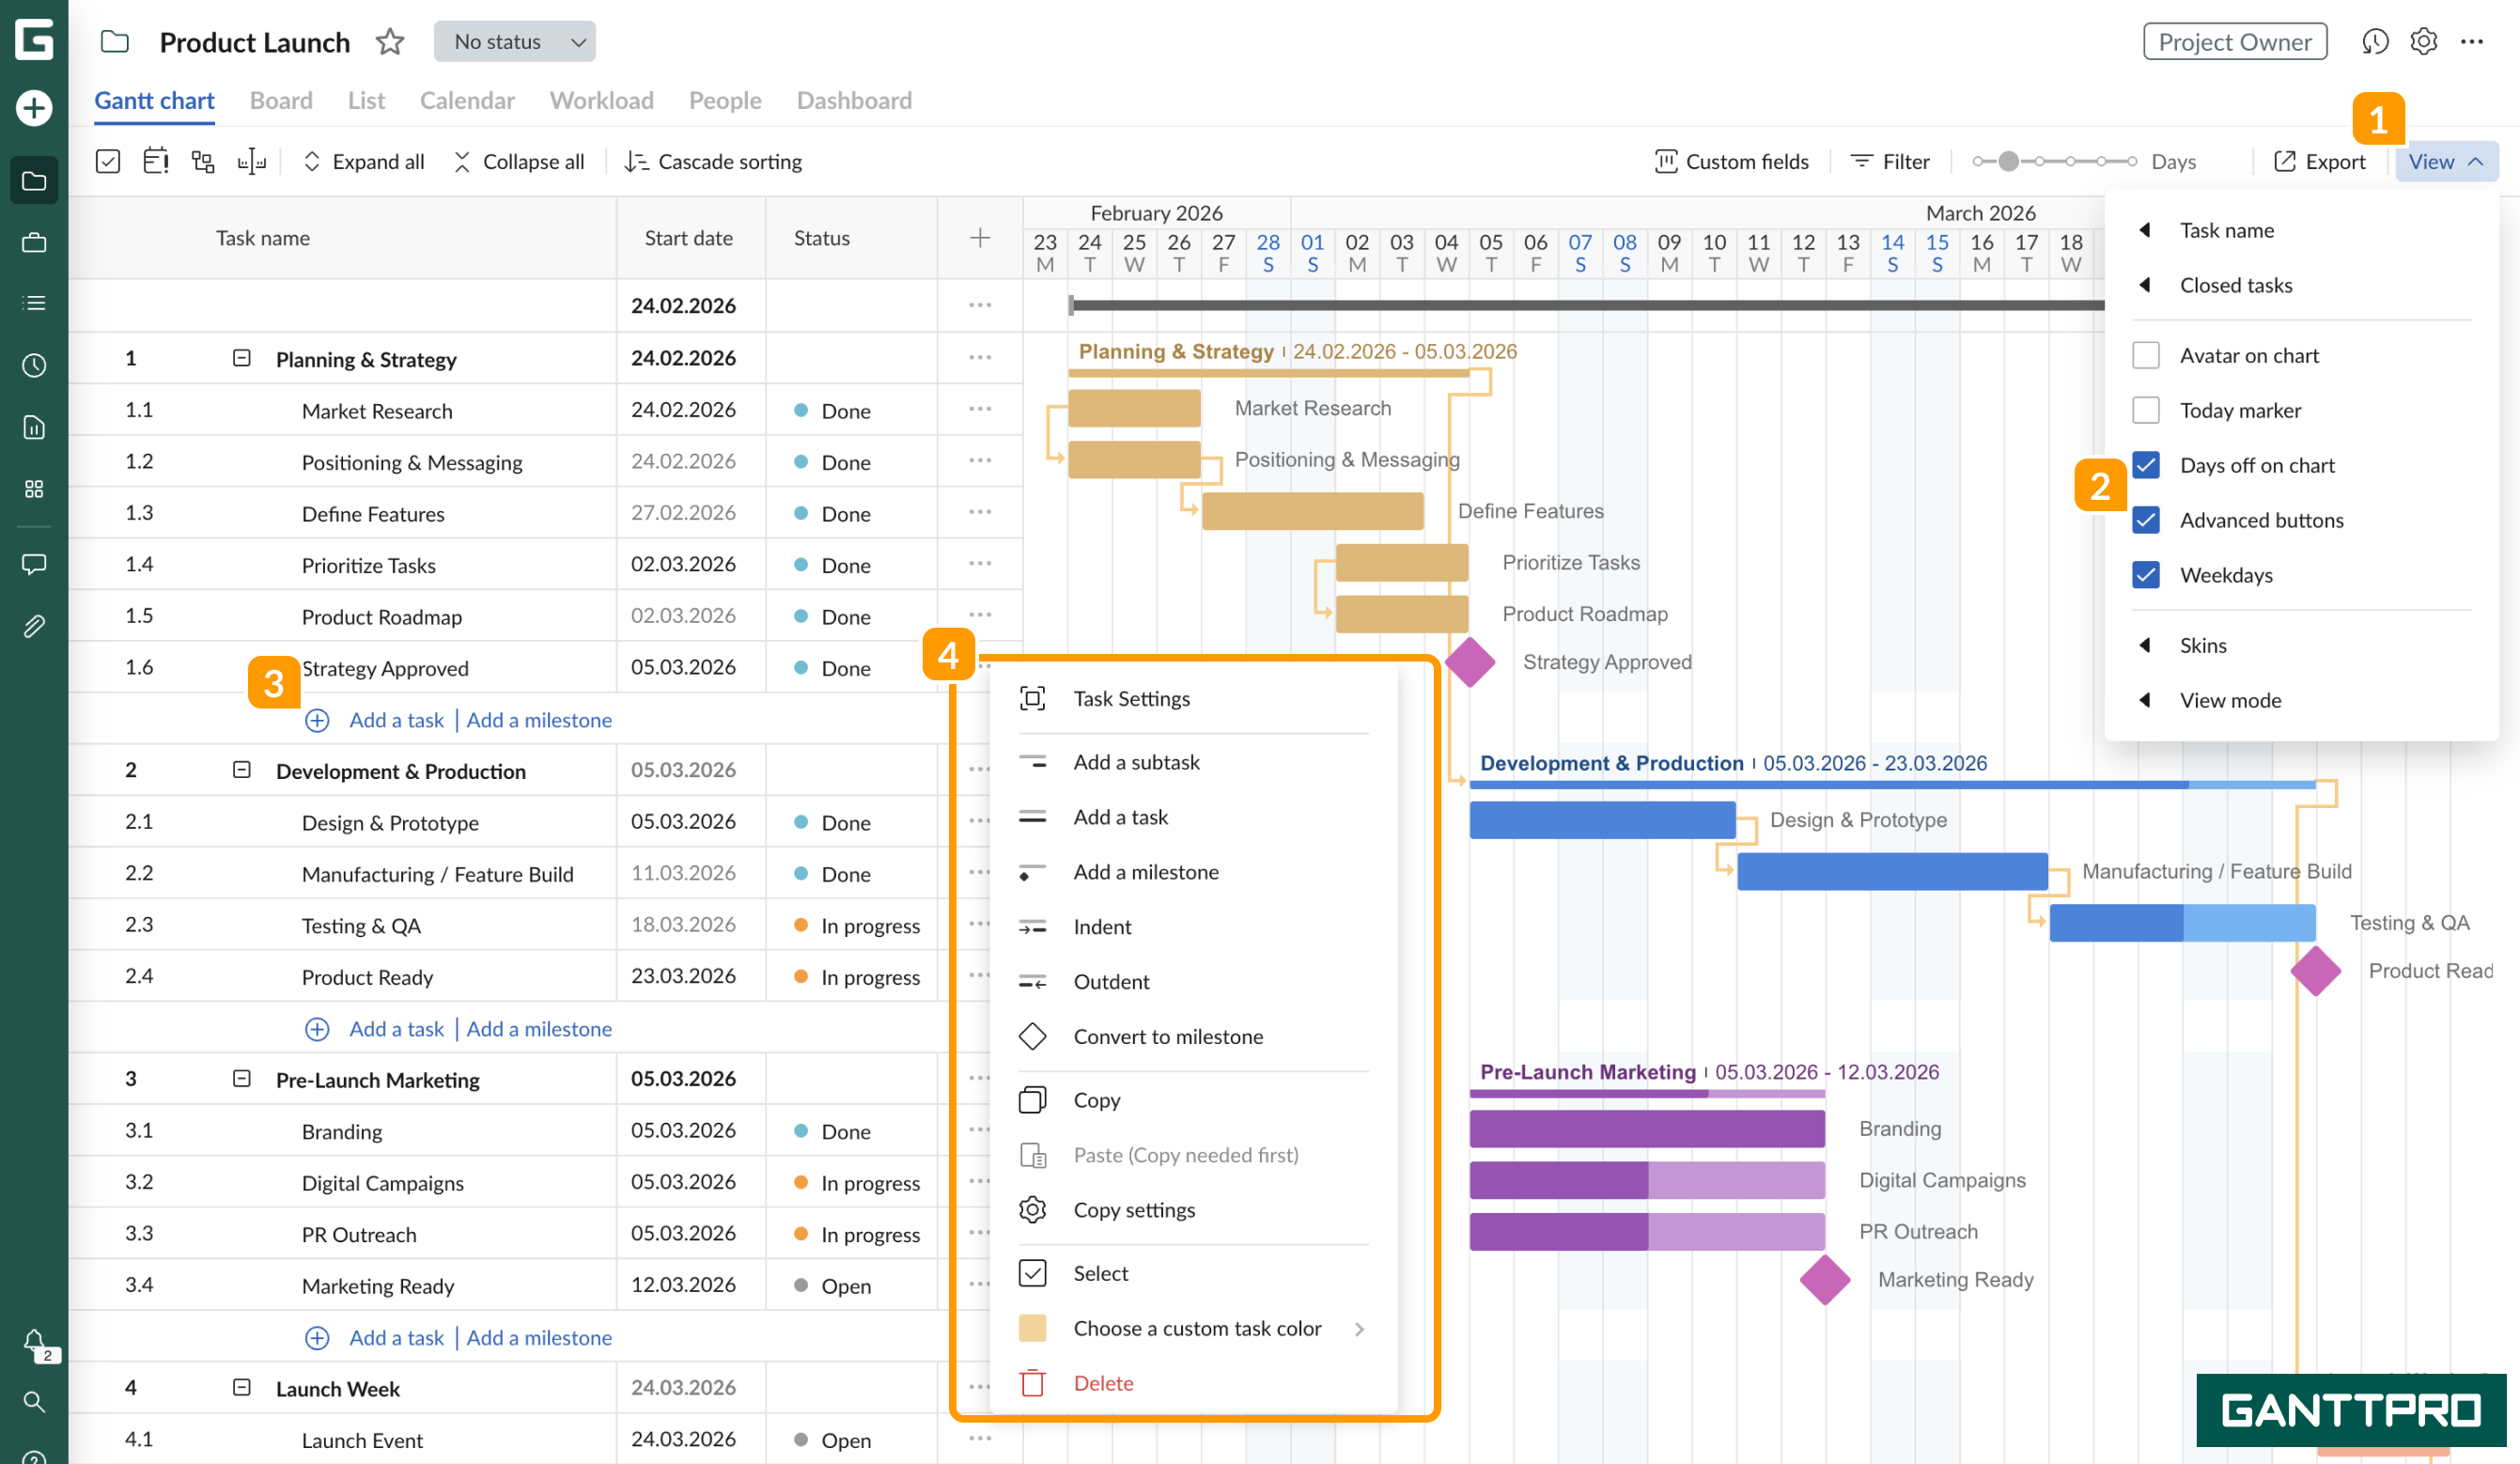
Note: This option is not available for users who don’t have permission to add tasks and milestones.
You can always add tasks, subtasks, and milestones by clicking on the three dots 4 to the right of the corresponding task.
Weekdays
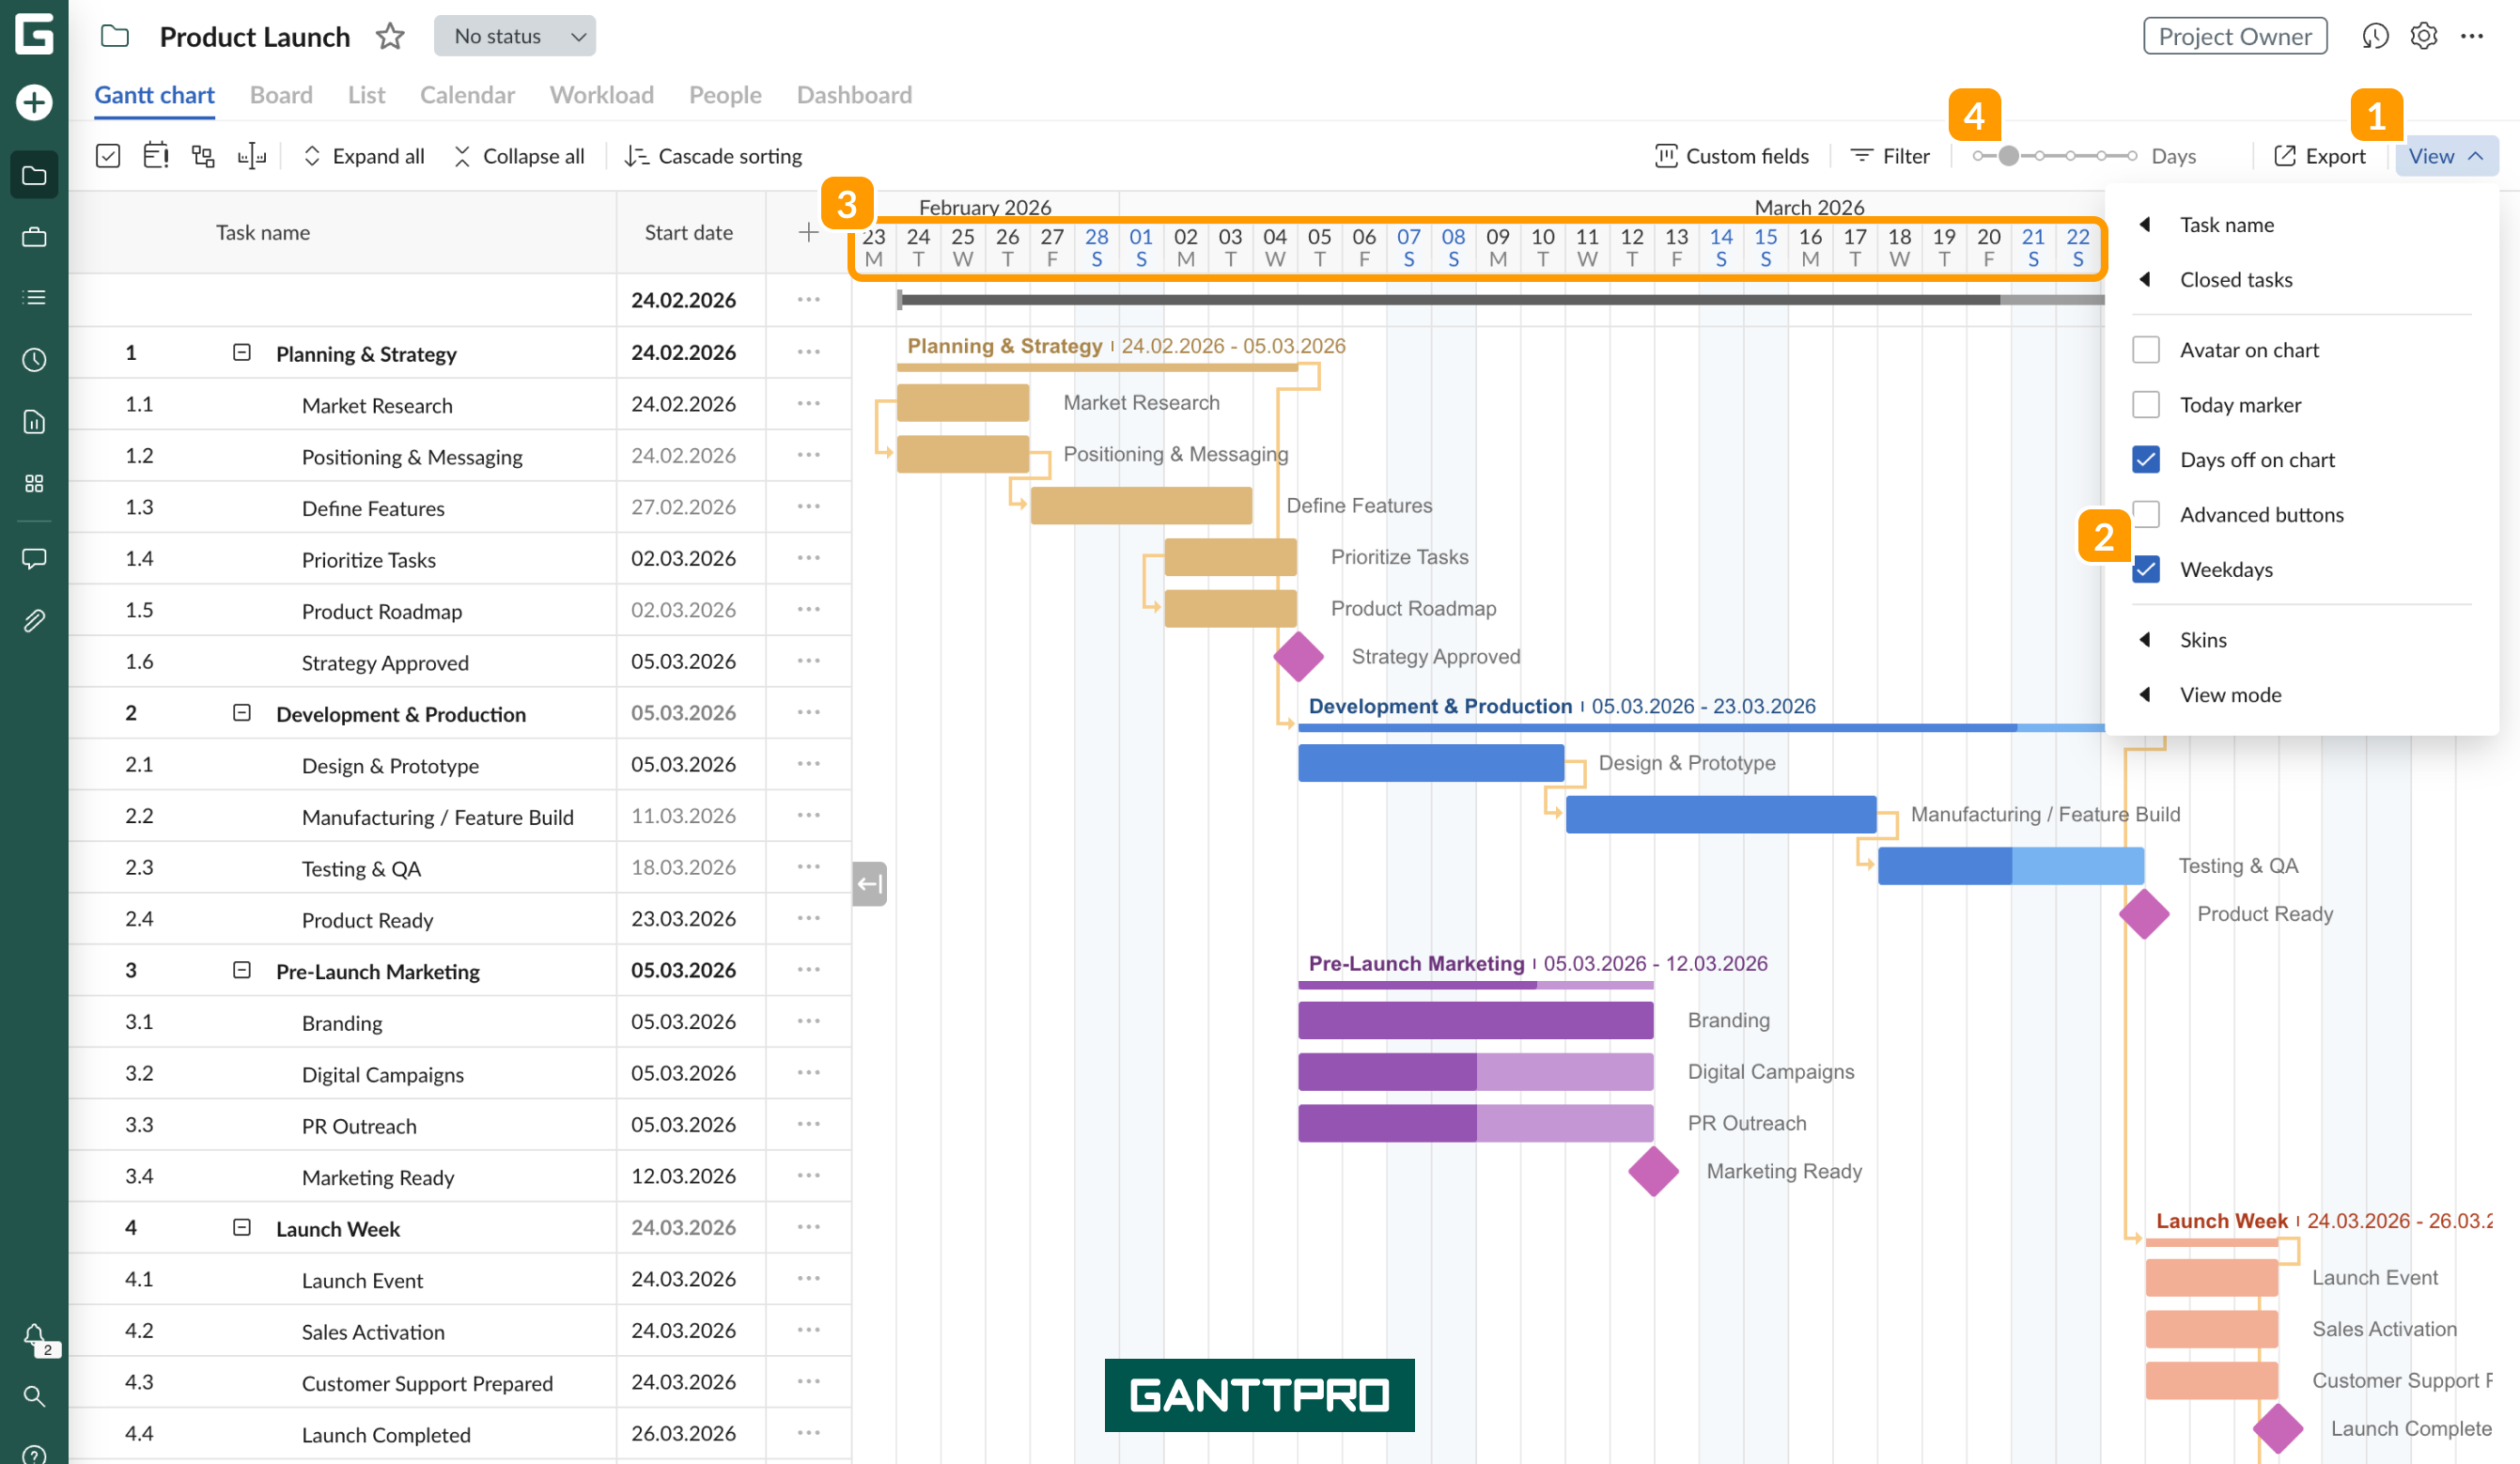
Turning on the Weekdays 2, which is week days on the chart, you can easier navigate across the chart. You can see days of the week under calendar dates numbers 3.
Remember to adjust the timeline using Zoom 4, as weekdays are only seen on the timeline when Zoom is set to days.
Skins
In the Skins mode 2, you can configure the way your project grid looks like. You can choose one out of four options 3, which will affect the way your fields 4 will look like.
View mode
In the View mode 2 you can configure the size of the rows 4. You can choose one out of three options: Auto, which is set by default, Compact 3 and Touch.